Structural Change in Australian Industry: The Role of Business Services | Speeches

The Australian economy has undergone many structural changes over time. One of the most
pronounced changes has been the transition away from a goods-producing economy towards a more
services-oriented economy.
Australians are producing more services, consuming more services and trading more services with
other economies than ever before. This trend has been apparent in most state economies over
recent decades, including here in Tasmania, where tourism has been an important source of growth
for the services sector.
One of the reasons for the shift to a services-based economy is that Australian households have
experienced remarkable growth in their real incomes. Australia has had over 25 years of
uninterrupted economic growth and real income per household has more than doubled since the
early 1960s. As incomes rise, households typically spend more of their income on household
services, such as health, education and restaurant meals, than on goods.
Demand for business services has also increased. Today I am going to focus on the fundamental
changes in the way business services industries interact with other industries and what this
tells us about the Australian economy. In summary, businesses that produce goods and distribute
them have become more specialised in their core activities, and have increasingly outsourced
their non-core activities to the business services sector. Some of this reorganisation has been
possible because technological change has lowered the costs of communication and logistics, and
has allowed a range of processes to be automated. Some outsourcing has just led to a change in
the industry where an existing activity is recorded. But some of these business services are
totally new. The outsourcing of business services to dedicated providers could be expected to
deliver efficiency gains and there is some evidence that this has happened. There is also
evidence that the nature of the work being done in the business services sector is generally
changing faster than in other sectors. This all suggests that business services are at the
centre of how technological change is transforming the Australian economy.
The Business Service Sector in Australia
The fact that the business service sector has become an increasingly important part of the
Australian economy is well known.
The business services sector has increased as a share of gross value added from less than 20 per cent
in the early 1990s to more than 25 per cent today (Graph 1). Broadly speaking,
the business services sector can be thought of as firms that provide assistance to other
businesses. In addition to what you might think of as traditional business services such as
accounting and legal services, this sector also includes a range of less traditional services
such as management consulting, internet providers and computer system design. The goods
production sector, which includes manufacturing, mining and construction, has seen a decline of
similar magnitude.
Graph 1
Some of the increase in demand for business services has come about from a reorganisation of
economic activity. As firms become more specialised in their areas of comparative advantage they
are likely to outsource some activities, such as catering and administrative functions, to more
specialised providers, even if the nature of the service being provided hasn’t changed much. Technological
change has played a role in this process by lowering the costs of communication and logistics
across firms, and has meant that the scope and complexity of what can be outsourced has
increased over time.
Technological change has also enabled the development of new ways to deliver services that
require specialist knowledge.
For example, IT-based systems designed to automate office processes may require a significant
investment to develop that will be hard to justify for an individual firm, especially if it is
small, even though the efficiency gains of automating the process can be substantial. In that
case it makes sense to purchase from a provider who specialises in developing IT systems to take
advantage of economies of scale by providing their services to many users.
One indicator of how the industrial structure of the economy has changed is to look at the way
definitions and the measurement of industries have evolved over time. In the 1962/63 national
accounts there were 69 manufacturing categories and 6 business services categories.
More recently, the data have only covered 51 manufacturing categories in detail, but have
increased the number of business services categories to 16. Later this year the ABS will release
data that splits out Computer System Design and Related Services from the Professional,
Scientific, and Technical Services industry. This is one example where the role of technological change can be
easily identified. Another example is the Communication Services industry, which included
postal, courier, and telecommunications services 50 years ago. Today, these services are found
in the much broader industry Information Media and Telecommunications, which also includes
Internet Publishing & Broadcasting, Internet Service Providers & Web Search Portals, and Data
Processing Services.
Another way to understand the reorganisation of Australian industries is to look at how the
interdependencies between various sectors of the economy have changed over time. This can be
done by using the input-output tables that are created by the Australian Bureau of Statistics
(ABS) as a part of the system of national accounts. The input-output tables provide information
on the value being added by each industry in the economy at each stage of the production
process. They do this by allowing the value of intermediate inputs to be subtracted from the
value of an industry’s output.
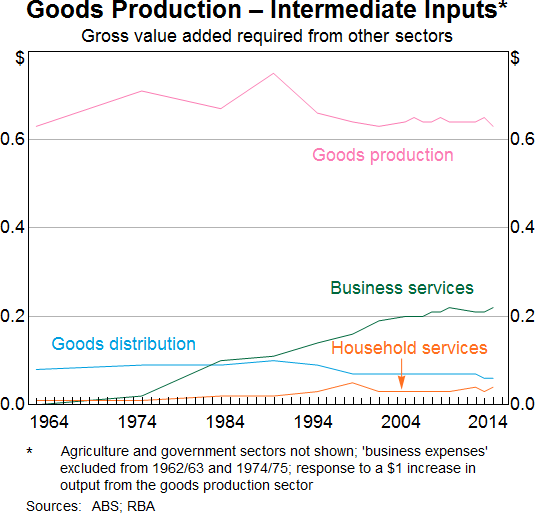
This graph shows how much additional demand for intermediate inputs there will be for one extra
dollar of goods production (Graph 2).
The additional demand generated for the output of the goods distribution and household services
sectors has been largely stable over time, but the additional demand for intermediate inputs
from the business services sector has increased from close to nothing fifty years ago, to just
over 20c today. This is consistent with the observation that technological change has enabled
goods-production firms to become more specialised in their core activities by
outsourcing some of their activities to the business services sector.
Graph 2
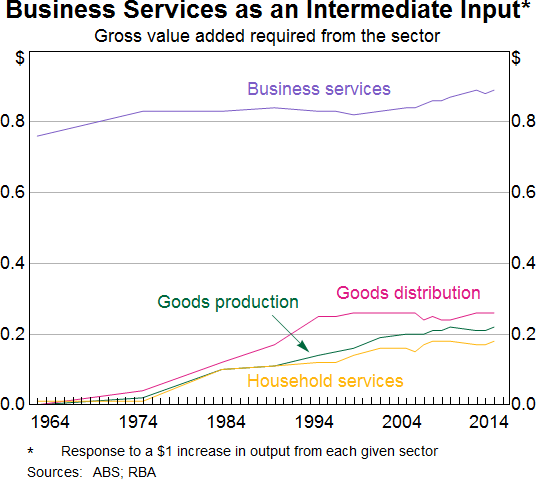
Interestingly, the value added by intermediate inputs from the business services sector has
become more important for all sectors in the economy, including the business services sector
itself (Graph 3).
Graph 3
The increasing integration of business services with other sectors of the economy is consistent
with evidence that supply chains have lengthened over time. A number of studies have documented
the lengthening of global supply chains as production has become more fragmented across
economies.
Recent work at the Bank has also highlighted the lengthening of supply chains in Australia.
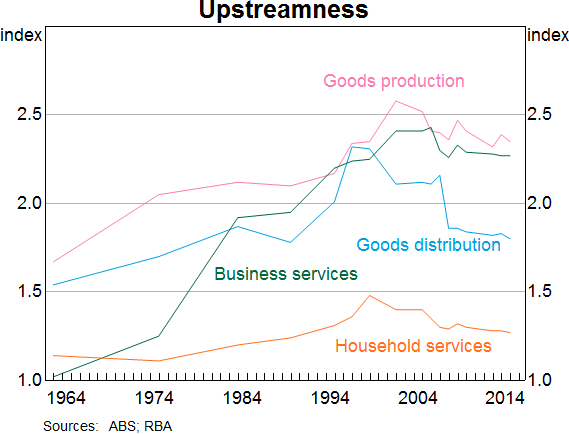
One way to measure the length of the supply chain is to estimate the average number of stages
that lie between a given sector’s production and final demand. This measures the ‘upstreamness’
of a sector or industry in the supply chain.
This graph confirms that the business services sector has become more important as an
intermediate input into the production of other sectors (Graph 4). The household services
sector is, unsurprisingly, the most downstream sector, being the closest sector to final
consumption.
Graph 4
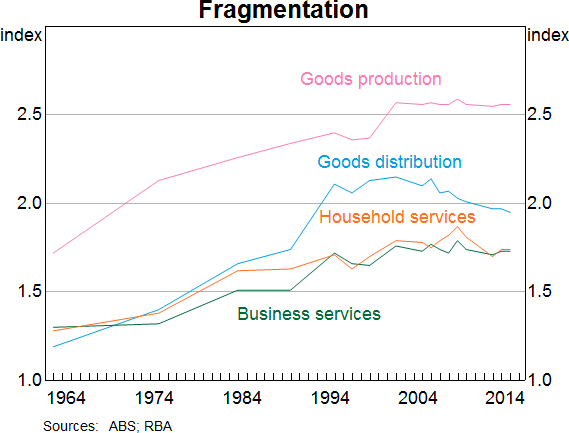
Another common measure of supply chain length is ‘fragmentation’, which estimates the
number of stages involved in the production of a sector’s output, taking into account how
the overall value added of the product is distributed along these stages. The goods
production sector is the most fragmented sector because it uses the most intermediate inputs
(Graph 5). Business and household services are the least fragmented sectors of the economy
indicating that they use fewer intermediate inputs. The increase in fragmentation across all
sectors over time, particularly before the 2000s, is consistent with the other evidence that
supply chains in the economy have been getting longer.
Graph 5
If the reorganisation of activities across industries is the result of more specialisation,
returns to scale and a more efficient organisation of activities across firms, multi-factor
productivity (MFP) should be growing more strongly when supply chains are lengthening. The
increasing integration across sectors associated with longer supply chains should also boost MFP
growth by making it easier to share technologies and productivity gains across the economy (Dao
et al 2017).
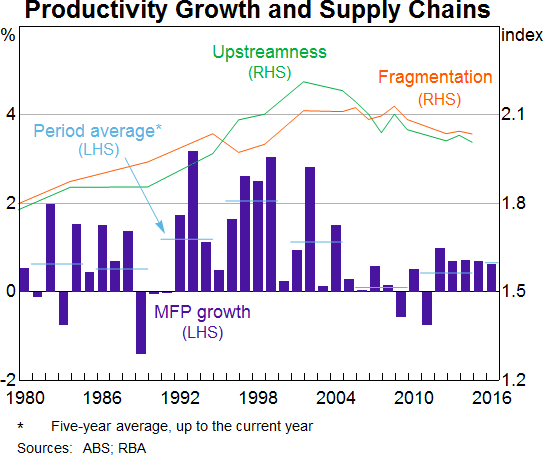
This graph shows that there is some correlation between growth in MFP and the lengthening of
supply chains as measured by upstreamness and fragmentation (Graph 6). Generally, it is
very difficult to attribute changes in productivity to any one causing factor, so this graph
should not be over interpreted. But, at the very least, the graph suggests a productive line of future
research as access to firm-level data sets, such as the ABS’s BLADE dataset, improves.
Graph 6
Employment in Business Services
Another source of information about the way structural change is occurring in the Australian
economy and the part played by business services is the labour market. The literature suggests
that the reorganisation of activity associated with the lengthening of supply chains has led to
a shift towards more high-skilled labour, and that this has been more pronounced in advanced
economies, such as Australia (Timmer et al 2014). More generally, there is a growing body of
evidence that shows technological change in the form of advances in computer-based technology
has been an important driver of a shift from routine to non-routine jobs (Autor, Levy and
Murnane 2003). Evidence for Australia suggests that this process has created new jobs as well as
making others obsolete, but that the effects of technological change on the labour market are
not more dramatic now than in recent decades (Borland and Coelli 2017).
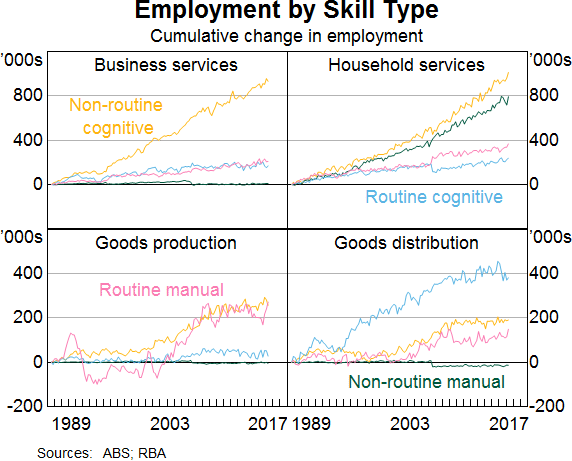
The data for Australia show that the share of people employed in the business services sector has
almost doubled over the last fifty years, to be almost 20 per cent of the workforce in
2016. Most of the growth in employment in the business services sector has been in non-routine
cognitive jobs, which is what you would expect if technological change was an important driver
(Graph 7). This graph suggests that similar forces have been at work in the household
services sector, although there has also been a significant increase in demand for non-routine
manual jobs in this sector.
Graph 7
Another perspective can be gained by considering how the specific skills and abilities required
in the business services sector have changed over time. This can be done using detailed
information about what skills and abilities are required in different occupations and data on
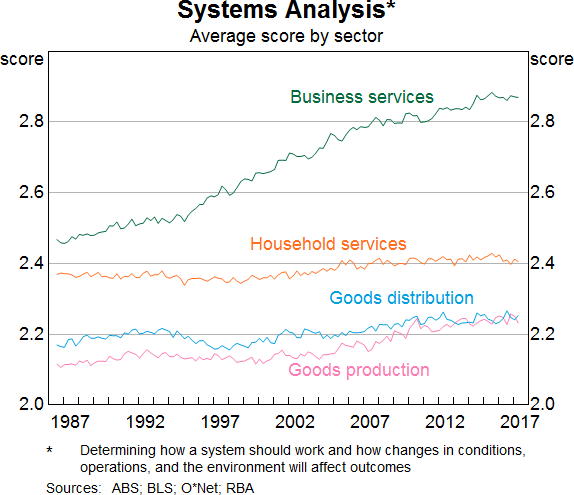
how the demand for different occupations has changed. For example, one of
the skills that has become increasingly important in the economy is the ability to analyse
systems. This skill has always been more important in the business services sector, however,
since the mid 1990s, there has been a noticeable shift towards occupations requiring this skill
(Graph 8).
Graph 8
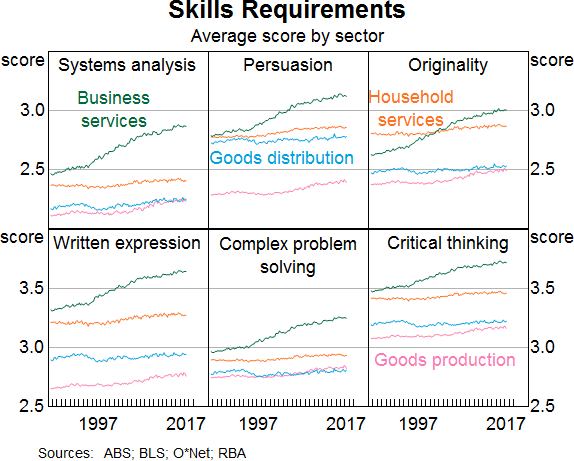
The picture is the same for a range of higher-level cognitive skills and abilities that have
become more important over time (Graph 9). Most of the change is coming from the business
services sector. There has been a corresponding decline in the importance of more physical
skills, such as coordination and manual dexterity.
Graph 9
Conclusion
Collectively, the evidence suggests that the business services sector has played a key role in
the way the economy has responded to technological progress. In the process, business services
have become more important, more specialised and more integrated with other sectors. There is
some evidence that this has been associated with higher productivity growth. Data from the
labour market also support the idea that business services industries are at the heart of how
technological change is transforming the structure of the economy. But more work needs to be
done to gain a better understanding of how technological change might affect the economy through
these channels and drive productivity growth into the future.
Bibliography
Antràs P, D Chor, T Fally and R Hillberry (2012), ‘Measuring the Upstreamness
of Production and Trade Flows’, American Economic Review, 102(3), pp 412–416.
Autor DH, F Levy and RJ Murnane (2003), ‘The Skill Content of Recent Technological
Change: An Empirical Exploration’, The Quarterly Journal of Economics, 118(4), pp 1279–1333.
Bartel AP, S Lach and N Sicherman (2014), ‘Technological Change and the Make-or-Buy
Decision’, The Journal of Law, Economics and Organization, 30(1), pp 165–192.
Berlingieri G (2013), ‘Outsourcing and the Rise in Services’, Centre for
Economic Performance Discussion Paper 1199.
Borland J and M Coelli (2017), ‘Will Robots Take Our Jobs?’, July. Available
at
Connolly E and C Lewis (2010), ‘Structural Change in the Australian Economy’,
RBA Bulletin, September quarter, pp 1–10.
Dao MC, M Das, Z Koczan and W Lian (2017), ‘Why is Labor Receiving a Smaller Share
of Global Income? Theory and Empirical Evidence’, IMF Working Paper WP/17/169.
De Backer K and S Miroudot (2013), ‘Mapping Global Value Chains’, OECD Trade
Policy Paper No. 159, December. Available at
Fally T (2012), ‘Production Staging: Measurement and Facts’, unpublished
manuscript, University of Colorado-Boulder, August, unpublished manuscript. Available at
Francois J, M Manchin and P Tomberger (2015), ‘Service Linkages and the Value Added
Content of Trade’, The World Economy, 38(11), pp 1631–1649.
Heath A (2016), ‘The Changing Nature of the Australian Workforce’, CEDA –
Future Skills: The Education and Training Pipeline, Brisbane, 21 September.
Herrendorf B, R Rogerson and Á Valentinyi (2014), Handbook of Economic Growth,
Growth and Structural Transformation, Volume 2, pp 855–941.
Hummels D, J Ishii and K-M Yi (2001), ‘The Nature and Growth of Vertical
Specialization in World Trade’, Journal of International Economics, 54, pp 75–96.
Johnson RC and G Noguera (2012), ‘Fragmentation and Trade in Value Added Over Four
Decades’, NBER Working Paper 18186.
Kelly G and G La Cava (2014), ‘International Trade Costs, Global Supply Chains and
Value-added Trade in Australia’, RBA Research Discussion Paper No 2014-07.
Kuznets S (1973), ‘Modern Economic Growth: Findings and Reflections’,
American Economic Review, 63(3), pp 247–258.
Los B, MP Timmer and GJ de Vries (2015), ‘How Global are Global Value Chains? A New
Approach to Measure International Fragmentation’, Journal of Regional Science,
55(1), pp 66–92.
Manalo J and D Orsmond (2013), ‘The Business Services Sector’, RBA Bulletin,
March quarter, pp 1–10.
McLachlan R, C Clark and I Monday (2002), ‘Australia’s Services Sector: A
Study in Diversity’, Productivity Commission Staff Research Paper. Available at
Productivity Commission (2003), ‘Trends in Australian Manufacturing’,
Commission Research Paper. Available at
Rayner V and J Bishop (2013), ‘Industry Dimensions of the Resource Boom: An
Input-Output Analysis’, RBA Research Discussion Paper No 2013-02.
Timmer MP, AA Eurmban, B Los, R Stehrer and GJ de Vries (2014), ‘Slicing Up Global
Value Chains’, Journal of Economic Perspectives, 28(2), pp 99–118.
United Nations (2015), ‘Central Product Classification (CPC) Version 2.1’,
United Nations Department of Economic and Social Affairs Statistics Division Statistical
Paper. Available at
Source link


