
Effects of appearance modifications on oral presentation anxiety in video conferencing

We compared the effects of the two aforementioned face filters on speakers’ anxiety during presentations in a real video conference scenario. We employed a between-group design to minimize practice effects. The participants were randomly divided into one of three groups (conditions):
-
The Good Friend Interviewer (GFI) group, where the interviewer’s appearance is modified to resemble that of the speaker’s good friend.
-
The Anime Character Interviewer (ACI) group, where the interviewer’s appearance is modified to resemble that of an attractive anime character.
-
The Stranger Interviewer (SI) group, where the interviewer appeared as a default stranger, as the control condition.
Experiment design
We designed an experiment in which participants delivered a 3-minute presentation in front of an interviewer who used existing software to apply face filters, masking his real appearance. We utilized Avatarify Desk (https://github.com/alievk/avatarify-desktop) to manipulate the appearance of the interviewer as seen by the participants. This software maps real-time facial and head movements onto a subject in a photograph, enabling characters in still images to exhibit natural expressions and bodily movements, closely resembling those in actual video interactions.
We invited a 30-year-old male PhD candidate from another unit to act as our interviewer (practical assistant). Before each experiment, the interviewer conducted thorough tests to ensure that his facial expressions (neutral but slightly negative) and movements were accurately mapped onto the corresponding positions in the photograph. During the presentation task, the assistant was instructed to maintain eye contact with the participant throughout the session, except for 1–2 instances of looking down to simulate note-taking. If a participant finished their presentation early, the assistant would remain in the note-taking posture until the video conference automatically ended.
To better simulate an authentic interview environment, neutral reading tasks and quiet waiting periods were arranged before and after meeting the interviewer. These tasks served two purposes: first, to ensure participants were alone in the room during the video conference, giving the experimenter time to leave and re-enter; and second, to reduce pre-interview anxiety by redirecting participants’ attention to the reading material. The detailed task schedule was as follows:
-
1-minute neutral reading task: Participants were instructed to read the content displayed on the screen, which included experimental instructions and an introduction to the automatic transitions.
-
3-minute presentation task with the interviewer: The screen displayed a live video of the interviewer via Cisco Webex App version 42.6 (https://www.webex.com). To enhance immersion, the small window showing the participant’s video and the menu bar were disabled, allowing the interviewer’s video to occupy the entire screen.
-
30 seconds post-presentation reflection: A prompt displayed the message, “Presentation completed, please wait quietly for the experimenter to return,” simulating a brief period of reflection after the presentation.
The transitions between tasks were implemented by pre-loading the relevant materials in the corresponding sequence and setting them to automatically close at specific times. The detailed settings were as follows:
-
Full-screen reading material (top layer): Automatically closed after 60 seconds.
-
Adjusted video conferencing software window (middle layer): Automatically closed after 240 seconds.
-
Image with concluding text (bottom layer): Automatically closed after 270 seconds.
Based on the prior experiment56, the preparation time for the presentation was set at 7 minutes, which was sufficient for participants to outline their main points. The speech topic was assigned as: “Please introduce your strengths and/or weaknesses,” as this is one of the most common interview questions. Participants could choose to focus on either one aspect or both, aiming to reduce potential anxiety from prematurely ending their presentation.
For the ACI condition, we selected five male anime character images from the internet. These images were evaluated by 20 students based on familiarity, anxiety, and likability. The most highly rated character, which scored highest in likability and familiarity, and lowest in anxiety, was chosen as the ACI interviewer (See Fig. 1). For the GFI condition, participants provided a frontal photo of one of their good friends. For the SI condition, the practical assistant’s own frontal photograph was used as the stranger’s appearance. Thus, in the ACI and SI groups, the audience appearance was predetermined and consisted of a single character or face, whereas in the GFI group, the appearances varied. To standardize the visual presentation across conditions, we pre-adjusted the images to ensure similar head proportions and positioning on the screen. Using Adobe Photoshop, we also ensured uniformity in clothing, head size, and background, maintaining a light grey backdrop for all three conditions. These appearances are illustrated in Fig. 8, showcasing the visual representations of the interviewers across the conditions in eye-tracking results.
The experimental room layout is shown in Fig. 2, highlighting the equipment worn by participants, including the eye-tracking device (Tobii Pro Glasses 3) and the functional near-infrared spectroscopy (fNIRS) device (Hot-2000). Additionally, the setup features an infrared thermal imaging camera (InfReC R450). Furthermore, we administered questionnaires, including the State-Trait Anxiety Inventory (STAI), the Perception of Speech Performance Scale (PSP), and a self-designed questionnaire, to collect subjective data.
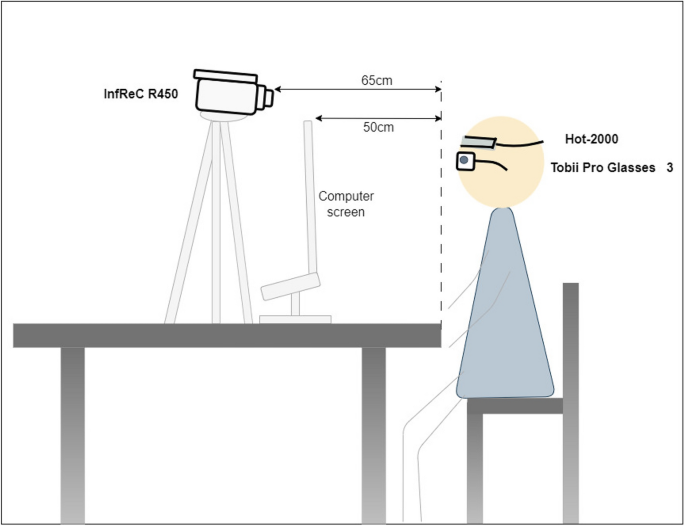
Layout of the experimental room and devices. Shows the participant’s position and measurement devices, including eye-tracking glasses, fNIRS, and thermal imaging.
Measures
Eye-tracking We utilized the Tobii Pro Glasses 3 (Tobii AB, Danderyd, Sweden), a wearable eye-tracking device resembling regular eyewear, designed for precise recording of participants’ eye movements. The system comprises a head unit, a recording unit, and a controller application, which can be installed on a computer for data management. The glasses feature removable lenses tailored to correct near-sightedness and far-sightedness, with lens options ranging from +3 to -8.0 diopters for each eye, adjustable in 0.5 diopter intervals. With a sampling rate of 100 Hz, the device was configured and calibrated for optimal accuracy in tracking eye movements.
The device recorded participants’ eye movements during the experimental tasks. This setup enabled us to analyze participants’ visual behaviors during the presentation task, offering valuable insights into their focus and attentional patterns.
Cerebral blood flow changes We utilized the Hot-2000 device (NeU Corp, Tokyo, Japan) to measure changes in cerebral blood flow. The device featured two source-detector (SD) pairs positioned on the left and right sides of the forehead, each consisting of a 1-cm SD pair and a 3-cm SD pair. The device emitted infrared light at a wavelength of approximately 800 nm and recorded data at a sampling rate of 10 Hz. The 3-cm SD pair functioned as a long-separation detector, capturing changes in blood flow linked to neural activity, while the 1-cm SD pair acted as a short-separation detector to filter out interference from the scalp.
Increased activity in the prefrontal cortex (PFC), particularly in the left PFC, has been shown to occur during the regulation of negative stimuli57,58. This device enabled us to analyze changes in participants’ cerebral blood flow before and after seeing the interviewer, potentially offering insights into the neural responses elicited by the interviewer’s appearance.
Thermal infrared imaging We used thermal imaging with the InfReC R450 device (Nippon Avionics Co., Ltd, Yokohama, Japan) to measure changes in participants’ nasal temperature. This non-contact method allows the detection of emotional states by capturing changes in facial temperature59,60,61. The InfReC R450 recorded facial temperatures at a rate of one frame per second, using a 480 \(\times\) 360 detector pixel array with spectral sensitivity ranging from 8 to 14 micrometers.
Alterations in nasal tip temperature are recognized as reliable indicators of anxiety, with lower temperatures correlated with heightened anxiety levels61,62,63. Fig. 3 displays the extracted nose region from the thermal images, which were intentionally blurred to preserve privacy. We employed the open-source project TIPA64 to automatically track the nasal region of interest. The device was positioned 70 centimeters from the participants, with blackbody calibration conducted prior to recording. This setup allowed us to monitor participants’ nasal temperatures during the presentation task, potentially providing insights into their physiological responses.
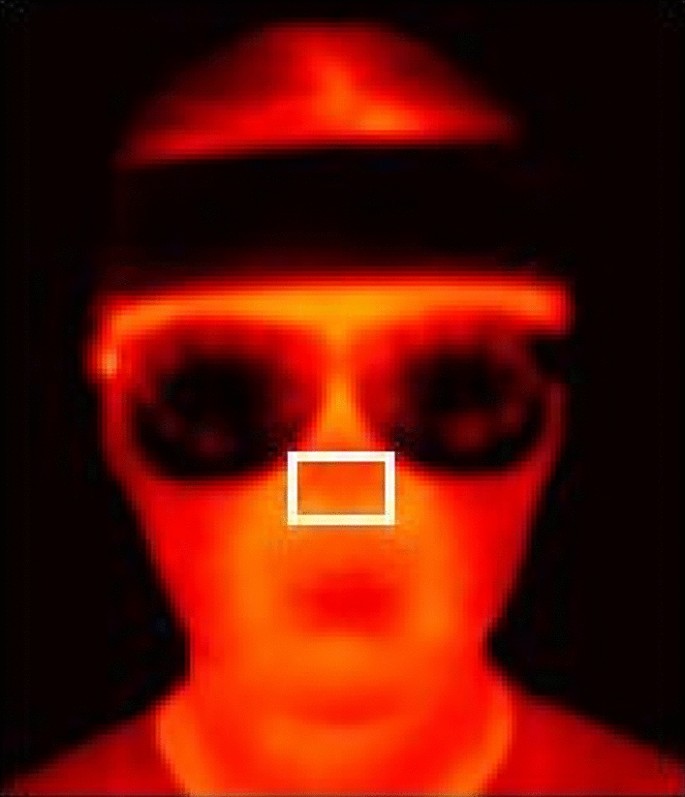
Extracted nasal region with privacy blur. Depicts the tracked nasal region used for thermal analysis while maintaining participant anonymity.
STAI-S The STAI65 consists of two scales: the State Anxiety Scale (STAI-S) and the Trait Anxiety Scale (STAI-T). The STAI-S assesses an individual’s feelings and emotions at the present moment, whereas the STAI-T measures more general and enduring anxiety tendencies. For our experiment, we utilized the Japanese STAI-S (Form-JYZ), which comprises 20 items (e.g., “I feel tense”) that are presented in a 4-point Likert scale format. The total score for state anxiety ranges from 20 to 80. Lower scores (20-44) indicate lower levels of state anxiety, reflecting calmness or a lack of temporary anxiety. Moderate scores (45-54) suggest moderate levels of state anxiety. Higher scores (55-80) indicate higher levels of state anxiety, reflecting greater temporary anxiety. After completing the presentation task, participants self-reported their current emotional state using the STAI-S. Previous studies have demonstrated strong internal consistency for the STAI-S66,67. In our study, the STAI-S exhibited exceptional internal consistency, with \(\alpha\)=.95.
PSP The PSP68 evaluates speech performance using 17 items, which cover both general aspects (5 items, e.g., “Appeared Nervous”) and specific aspects (12 items, e.g., “Voice Quivered”) of the speech. The participants were asked to rate their agreement with various statements regarding their speech performance on a scale ranging from 0 (“not at all”) to 4 (“very much”). Previous studies have consistently shown strong internal consistency when using the PSP scale for self-evaluation67,69,70,71. In our current study, the internal consistency of the total scale score for participant ratings is excellent, with \(\alpha\)=.87.
Self-designed questionnaire We designed an 8-item questionnaire using a 5-point Likert scale (items are listed in Table 1), with response options ranging from 1 (strongly disagree) to 5 (strongly agree). The purpose of this questionnaire was to evaluate the extent to which various factors potentially influencing anxiety levels were effectively controlled during the experiment. Rather than measuring a single latent construct, the questionnaire captured a broad range of participants’ subjective experiences across multiple dimensions, including perceived familiarity, perceived kindness, and distraction. Additionally, an open-ended section was included to allow participants to freely share their thoughts and feelings, providing further qualitative insights.
Experiment procedure
Participants We recruited participants by sending an invitation email to all master’s and doctoral students at our university. The email outlined the experiment content, which is a real video interview experiment where participants deliver a presentation to an interviewer who uses a facial filter. A total of 45 participants, consisting of 33 males and 12 females, aged 22 to 29 years, were evenly distributed across three groups. Participants assigned to the GFI group were informed of submitting a frontal photo of a good friend. While the sample size of 45 participants may appear modest for a between-subjects design involving three conditions, it aligns with standards in the human-computer interaction (HCI) field. Based on a survey by Caine72, the average number of participants per condition in CHI publications is approximately 13. Our study exceeds this benchmark with 15 participants per condition, providing reasonable confidence in the robustness of the findings within this research context.
Considering that the interview language in the region was primarily Japanese, Japanese was designated as the language for oral presentations in the experiment. Among the participants, nine were native Japanese speakers. The remaining non-native Japanese participants possessed a proficiency level of N2 or above on the Japanese Language Proficiency Test, a standardized assessment certifying non-native speakers’ Japanese language skills. A passing grade of N2 or above demonstrates strong abilities in comprehending complex texts, engaging in advanced conversations, and writing at a high level, making it widely recognized for non-native speakers working, studying, or living in Japan. We evenly distributed the participants’ Japanese proficiency levels across the three groups. All participants had experience in online Japanese-language interviews, whether for employment, academic advancement, or simulation training.
On the day of the experiment, participants were provided with a verbal introduction by the experimenter, following the details outlined in a written document. This introduction covered the purpose and content of the experiment, instructions on the types of equipment to be used, details about the data to be collected, its storage duration, and the compensation rate set by the university. They were also informed that the interviewer’s appearance in the video call had been modified using a facial filter and that behind the filter was a real person from outside the university who would evaluate their presentation. The experimenter also emphasized that participants could stop the experiment at any time if they felt uncomfortable. Once participants fully understood the provided information and had no further questions, they voluntarily signed a consent form and completed a personal information sheet to receive compensation.
Subsequently, we introduced a separate document containing screen transition demonstrations. This document included the content for the neutral reading task, simple diagrams representing the interviewer shown during the presentation task, and the quiet waiting instructions displayed at the end. We emphasized that any errors or omissions during the reading task would not affect the experiment, as the data collection focused on the presentation task. This served to highlight the importance of the presentation task while reducing potential pressure during the reading task. Participants were given five minutes to familiarize themselves with the reading task, which also included instructions to minimize head movement and avoid ending their presentation prematurely. Then, participants received a sheet of paper with the assigned speech topic and blank space to draft notes or prepare their presentations during the 7-minute preparation time.
Afterward, participants were directed to sit in front of the computer screen. The experimenter replaced the necessary lenses and connected the head and recording units as outlined in the Tobii Pro Glasses 3 manual. Participants wore eye-tracking glasses continuously, even during rest periods, to adapt to their weight (76.5 grams, including the connecting cable). Participants then positioned the fNIRS device on their dry foreheads, ensuring no interference from hair, as per the Hot-2000 manual. Once the placement was confirmed, device measurements began. The experimenter also activated the infrared camera at this stage. After a 3-minute rest, the experimenter calibrated the eye-tracking glasses according to the Tobii Pro Glasses 3 User Manual. During calibration, a calibration card was placed on the computer screen, and participants were instructed to focus on its center. Calibration was initiated via the application interface, and upon successful completion, eye-tracking data recording commenced. Figure 4 illustrates the operational status of these devices during the experimental process, while Fig. 5 presents a photo of a participant wearing both the eye-tracking and fNIRS devices. Privacy concerns were addressed by applying image blurring to the photo.
After calibration, the experimenter left the room, and the computer screen displayed the reading task. Participants independently completed the following tasks shown on the screen. The room temperature was controlled between 18-\(20^{\circ }\text {C}\), which was considered a comfortable temperature by the participants. The interviewer was located in a room on the other side of the campus, and his side of the video call was set to mute to act as the audience. As a result, participants were in a quiet room while delivering the presentation to the interviewer.
After 250 seconds, the experimenter returned and shut down the types of equipment. Participants then completed the questionnaires on the computer screen using a mouse. In the final section of the self-made questionnaire, they were encouraged to verbally describe their experiences and express their feelings. The experimenter recorded their responses through audio. Finally, the experimenter engaged in a brief conversation with them to address any questions they had. The entire experiment lasted approximately 40 minutes, and participants received a compensation of 1,000 JPY.

Overview of the experimental procedure. Illustrates task order and device usage during the presentation experiment.
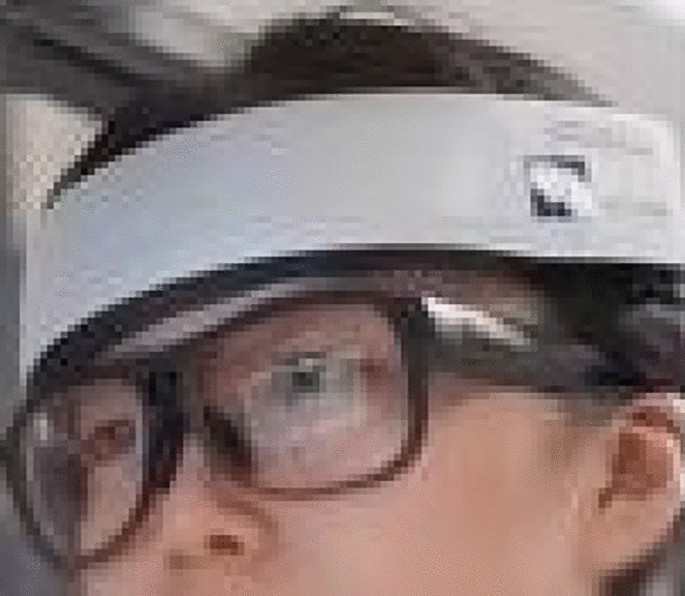
Participant wearing measurement devices. Displays the setup of eye-tracking glasses and the fNIRS device during data collection.
Ethics and Consent Statement The study was approved (Approved No. 04-013) by the Japan Advanced Institute of Science and Technology Life Science Committee on July 27, 2022. All methods were performed in accordance with the relevant guidelines and regulations. The recruitment period for the validation experiment was from August 1, 2022, to November 1, 2022. Participation was voluntary and signed written informed consent forms. Additionally, participants were informed that they could withdraw or terminate the experiment at any time without any negative consequences. Pre-counseling and post-counseling sessions were conducted before and after the experiment, respectively, to alleviate potential discomfort caused by the measurement devices and to mitigate the potential impact of the experiment.
All figures containing identifying information in this manuscript were obtained with the informed consent of the respective participants for the publication of their identifying information/images in the online open-access publication.
Experiment results
Due to technical issues, three participants required additional data and were subsequently excluded from the analysis. Thus, the statistical analysis included data from 45 participants, consisting of 33 males and 12 females between the ages of 22 and 29.
Because the data were not normally distributed (Shapiro-Wilk, p<.05), we employed non-parametric tests for the statistical analysis. For each dependent variable, we performed a Kruskal-Wallis omnibus test followed by Mann-Whitney U tests for pairwise group comparisons when appropriate, and Bonferroni correction for multiple comparisons was applied as implemented in IBM SPSS Statistics version 27 (https://www.ibm.com/products/spss-statistics). However, correction was not applied across the full set of all p values reported in the study.
Perception
STAI-S Figure 6 shows the distribution of scores on the self-reported current anxiety state scale among the three groups, with higher scores indicating higher anxiety levels. A Kruskal-Wallis test revealed a significant difference in state anxiety scores across the three groups, H(2)=7.81, p=.020. The median scores were 31 for GFI, 50 for ACI, and 48 for SI. Follow-up Mann-Whitney U tests with Bonferroni correction showed that the GFI group reported significantly lower anxiety than both the SI group (Z=-2.41, adjusted p=.048, r=.36) and the ACI group (Z=-2.43, adjusted p=.045, r=.36). No significant difference was observed between the ACI and SI groups (Z=.03, adjusted p=1, r=0).

State-Trait Anxiety Inventory-State (STAI-S) scores across the three groups. Shows anxiety level differences among the Good Friends Interviewer (GFI), Anime Character Interviewer (ACI), and Stranger Interviewer (SI) groups, with lower scores indicating lower anxiety.
PSP Figure 7 shows the PSP scores of the participants’ self-evaluations in the three groups, with higher scores indicating a poorer perceived performance. A Kruskal-Wallis test revealed a significant difference in self-perceived performance across the three groups, H(2)=10.72, p=.005. The median scores were 21 for GFI, 34 for ACI, and 36 for SI. Post hoc Mann-Whitney U tests with Bonferroni correction indicated that participants in the GFI group rated their performance significantly better than those in the SI group (Z=-3.07, adjusted p=.006, r=.46) and the ACI group (Z=-2.53, adjusted p=.035, r=.38). No significant difference was found between the ACI and SI groups (Z=-.54, adjusted p=1, r=.08).
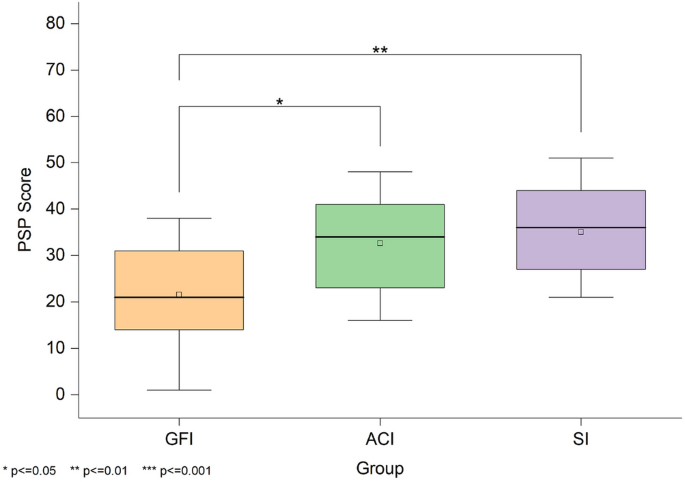
Perception of Speech Performance (PSP) scores across the three groups. Shows perceived speech performance in the Good Friends Interviewer (GFI), Anime Character Interviewer (ACI), and Stranger Interviewer (SI) groups, where lower scores correspond to better self-assessed performance.
Self-designed questionnaire Item 3 – Familiarity with the Interviewer’s Face. A Kruskal-Wallis test revealed a significant group difference in perceived familiarity with the interviewer’s face, H(2)=29.45, \(p<\).001. Follow-up Mann-Whitney U tests with Bonferroni correction showed that participants in the GFI group rated the interviewer as significantly more familiar than both the SI group (Z=4.23, adjusted \(p<.001\), r=.63) and the ACI group (Z=5.06, adjusted \(p<.001\), r=.75). No significant difference was found between the ACI and SI groups (Z=-.83, adjusted p=1, r=.12).
Item 4 – Perceived Kindness of the Interviewer. A Kruskal-Wallis test indicated a significant difference in perceived kindness across groups, H(2)=8.06, p=.018. Post hoc comparisons revealed that participants in the GFI group perceived the interviewer as significantly kinder than those in the ACI group (Z=2.67, adjusted p=.023, r=.40). No statistically significant differences were observed between GFI and SI (Z=2.18, adjusted p=.088, r=.32) or between ACI and SI (Z=-.49, adjusted p=1.00, r=.07).
Item 8 – Fear Reduction During the Interview. A Kruskal-Wallis test found a significant difference in interview-related fear reduction, H(2)=9.45, p=.009. Pairwise tests indicated that the GFI group reported significantly more reduction in fear compared to the SI group (Z=3.06, adjusted p=.007, r=.46), while no significant differences were found between GFI and ACI (Z=1.76, adjusted p=.236, r=.26) or between ACI and SI (Z=1.31, adjusted p=.575, r=.20). No significant differences were observed between groups for the other items.
Several noteworthy points emerged from the spontaneous expressions of the participants. In the GFI group, participants mentioned experiencing dissonance when seeing foreign expressions or angles shown on familiar faces. In the ACI group, many participants expressed difficulty receiving feedback from the anime character, which caused unease. In the SI group, some participants reported that the interviewer was familiar because it aligned with their expectations of an interviewer, despite never having met him in real life.
Behavior
Eye-contact The recorded data were analyzed using Tobii Pro Lab version 1.207 (https://www.tobii.com/products/software/ behavior-research-software/tobii-pro-lab) to identify and quantify gaze interactions. We focused on the area of interest (AOI) around the interviewer’s eyes and analyzed the participants’ gaze duration and frequency within this area. To accurately capture participants’ gazes in dynamic situations, we utilized a dynamic AOI that can be repositioned to match targets in the video. We employed an automatic mapping system within the software to map the positions of an AOI from dynamic videos to static photos. Subsequently, frame-by-frame visual inspection and adjustments were made to ensure accurate correspondence. To ensure consistent exposure to the interviewer’s gaze, we analyzed the first 120 seconds of the presentation task; two participants finished their speech slightly over two minutes, and the interviewer maintained a downward gaze during the remaining time. We applied the Tobii I-VT attention filter with a threshold of 100 degrees per second, calculating both the duration and frequency of the participants’ gazes in the dynamic AOI. The heat maps in Fig. 8 depict the overall distribution of the eye movement data for each group. In the GFI, we focused the data on the specific photo, which is shown in a). Images a), b), and c) are actual screenshots of the screen participants faced during the presentation task. The gradient from green to yellow to red represents the continuum of fixation duration, which ranges from short to long.
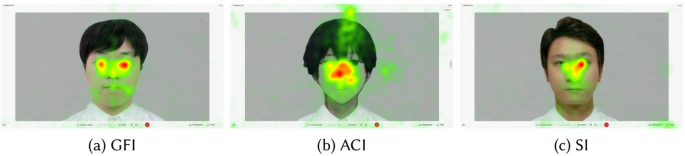
Overlaid heat maps of gaze fixation during the presentation task. Shows the superimposed gaze patterns from the participants under the Good Friends Interviewer (GFI), Anime Character Interviewer (ACI), and Stranger Interviewer (SI) groups during presentations. Colors from green to yellow to red indicate fixation durations from short to long.
The total duration of the whole fixation within the AOI under the three groups is shown in Fig. 9. A Kruskal-Wallis test revealed a significant difference in the total duration of fixations on the interviewer’s eyes across the three groups, H(2)=9.15, p=.010. The median scores were 54.53 for GFI, 12.10 for ACI, and 31.33 for SI. Follow-up Mann-Whitney U tests with Bonferroni correction showed that participants in the GFI group maintained significantly longer gaze duration than those in the ACI group (Z=3.01, adjusted p=.015, r=.45). No significant differences were observed between GFI and SI (Z=1.22, adjusted p=1.00, r=.18) or between ACI and SI (Z=-1.72, adjusted p=.516, r=.26).

Fixation duration within the eye region of interest. Shows the total time participants spent fixating on the interviewer’s eye region under the Good Friends Interviewer (GFI), Anime Character Interviewer (ACI), and Stranger Interviewer (SI) groups.
The number of whole fixations within the AOI under the three groups is shown in Fig. 10. A Kruskal-Wallis test indicated a significant difference in the number of fixations across conditions, H(2)=8.68, p=.013. The median scores were 103 for GFI, 50 for ACI, and 136 for SI. Follow-up comparisons indicated that participants in the GFI group made significantly more fixations on the interviewer than those in the ACI group (Z=2.69, adjusted p=.043, r=.40). No significant differences were found between the GFI and SI groups (Z=.22, adjusted p=1.00, r=.03) or between the ACI and SI groups (Z=-2.38, adjusted p=.103, r=.36).
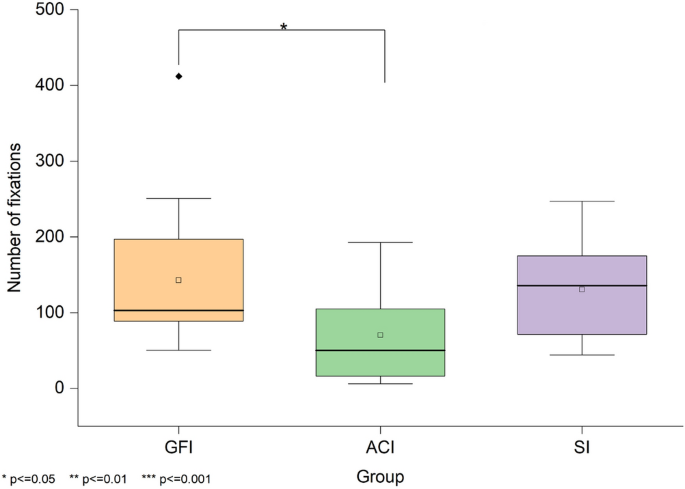
Fixation count within the eye region during the presentation task. Shows the total number of fixations on the interviewer’s eye region across the Good Friends Interviewer (GFI), Anime Character Interviewer (ACI), and Stranger Interviewer (SI) groups.
Word count We analyzed the number of complete words spoken by the participants during the 3-minute interview sessions. We employed Whisper software (https://github.com/openai/whisper) to transcribe the participants’ spoken content into text and subsequently quantified it. A Kruskal-Wallis test revealed a significant difference in word count across the three groups, H(2)=6.06, p=.048. The median scores were 517 for GFI, 512 for ACI, and 441 for SI. Post hoc comparisons indicated only a trend toward a higher word count in the GFI group compared to the SI group (Z=2.43, adjusted p=.090, r=.36).
Correlation
We utilized Spearman correlation analysis to individually compare the following variables in pairs: STAI_S, PSP, fixation duration, fixation number, and word count (see Table 2). The results revealed a strong positive correlation between fixation duration and fixation number. Additionally, a strong positive correlation was observed between the STAI_S and PSP scales, indicating that higher self-reported anxiety levels were associated with poorer perceived performance. Both scales displayed a weak negative correlation with word count, suggesting that speaking less during the presentation was somewhat associated with higher self-perceived anxiety and lower self-perceived performance.
Physiological data
Nasal temperature To minimize individual differences, we first calculated the nasal temperature changes by subtracting the temperature recorded during a continuous 120-second resting period from that recorded during the first 120-second presentation task period, using the same rationale as in the eye-contact analysis. To capture the psychological changes triggered by the gaze of the interviewer, we further subtracted the average nasal tip temperature from the last 30 seconds of the reading task. The last 30 seconds of the reading task were selected to minimize the influence of the experimenter’s presence, as participants were alone in the room during this period after the experimenter had left, ensuring a consistent environment for baseline recording.
As shown in Fig. 11, which displays the average nasal temperature variations across participants for each group during the presentation task, the SI group appears to exhibit a more substantial decrease, while the other two groups show little difference. However, statistical analysis did not reveal any significant differences in nasal temperature changes among the three groups during this period.

Group-averaged nasal temperature changes. Shows nasal temperature changes during presentations under the Good Friends Interviewer (GFI), Anime Character Interviewer (ACI), and Stranger Interviewer (SI) groups as a physiological indicator of anxiety, with lower temperatures correlated with heightened anxiety levels.
Brain activity We calculated the changes in cerebral blood flow between -2 and 4 seconds from the start of the interviewer-interviewee meeting, aligning with the observation time in the previous study73. However, no significant differences were observed across conditions. Figure 12 illustrates the mean change in cerebral blood flow over time in the left PFC. The right side of the dashed line corresponds to the change in cerebral blood flow after the interviewer’s appearance, corrected by the mean value 2 seconds before the interviewer’s appearance (left side of the dashed line). In our experiment, the observed increase in cerebral blood flow within the left PFC in the SI group could be related to the modulation of anxiety states experienced when facing the audience.

Group-averaged changes in left prefrontal cerebral blood flow. Shows changes in left prefrontal cortical blood flow at the time of interviewer appearance across the Good Friends Interviewer (GFI), Anime Character Interviewer (ACI), and Stranger Interviewer (SI) groups, reflecting potential anxiety-related neural responses.
Source link


