
Public speaking training in front of a supportive audience in Virtual Reality improves performance in real-life

Emotional experience
Data analyses were conducted to test whether participant’s emotional experience (measured via ratings) was affected by public speaking in front of a virtual (post VR-practice) or real audience (post Seminar) compared to a baseline measurement before the virtual public speaking task. In addition, we investigated whether experiences would differ as a function of audience behavior.
Arousal
A mixed ANOVA with the factors Audience and Time Point revealed only a main effect of Time Point, F(2,140) = 4.75, p = 0.010, ηp2 = 0.06. There was no significant main effect of Audience, F(2, 70) = 0.31, p = 0.735, ηp2 < 0.01, and no interaction between Audience and Time Point, F(4, 140) = 1.64, p = 0.168, ηp2 = 0.04. Post-hoc t-tests showed that arousal post Seminar was rated significantly higher than arousal post VR-practice, t(72) = 2.61, p = 0.033, d = 0.31, and arousal at Baseline, t(72) = 2.47, p = 0.033, d = 0.29. Arousal ratings post VR-practice did not differ significantly from arousal ratings at Baseline, t(72) = 0.36, p = 0.722, d = 0.04. Overall, arousal was higher during the real presentation than during the VR presentation but did not differ between audience groups (Fig. 1A).
Ratings of (A) arousal, (B) valence, (C) feeling of control, (D) stress, and (E) anxiety as a function of time point (within-subject) and audience (between-subject). See Supplementary Material Fig. S1 for an illustration where different audience behaviors are aggregated within time points.
Valence
The mixed ANOVA showed no main effect of Audience, F(2, 70) = 0.07, p = 0.936, ηp2 < 0.01, no main effect of Time Point, F(2,140) = 0.70, p = 0.499, ηp2 < 0.01, and no interaction effect, F(4, 140) = 1.96, p = 0.105, ηp2 = 0.05. Unpleasantness of public speaking did not differ with respect to audience group and did not differ between presenting in the VR practice or the real-life seminar (Fig. 1B).
Control
Analysis of participants’ feeling of control for different audience groups and time points showed a main effect of Time Point, F(2,140) = 5.77, p = 0.004, ηp2 = 0.08, but no effect of Audience, F(2,70) = 0.13, p = 0.879, ηp2 = 0.08, and no interaction effect, F(4, 140) = 1.03, p = 0.396, ηp2 = 0.03. Post-hoc t-tests showed that feeling of control significantly increased from Baseline to post VR-Practice, t(72) = 2.57, p = 0.027, d = 0.30, and from Baseline to post Seminar, t(72) = 3.07, p = 0.009, d = 0.36. There was no significant change in the feeling of control between post VR-Practice and post Seminar ratings, t(72) = 0.46, p = 0.647, d = 0.05 (Fig. 1C).
Stress
The mixed ANOVA on stress ratings revealed a main effect of Time Point, F(2, 140) = 10.58, p < 0.001, ηp2 = 0.13, but no main effect for Audience, F(2, 70) = 0.26, p = 0.771, ηp2 < 0.01, and no interaction effect, F(4, 140) = 0.64, p = 0.632, ηp2 = 0.02. Post-hoc tests showed that stress ratings were significantly increased post Seminar compared to Baseline, t(72) = 3.98, p < 0.001, d = 0.43, and post VR-Practice, t(72) = 3.70, p < 0.001, d = 0.47. There was no change in stress ratings between Baseline and post VR-Practice assessment, t(72) = − 0.77, p = 0.440, d = 0.09. Overall, stress ratings were higher for the seminar presentation compared to the practice presentation but did not differ by audience group (Fig. 1D).
Anxiety rating
The analysis of anxiety ratings revealed a main effect of Time Point, F(2, 140) = 3.79, p = 0.025, ηp2 = 0.05, but no effect of Audience, F(2, 70) = 0.58, p = 0.562, ηp2 = 0.02, and no interaction effect, F(4, 140) = 0.90, p = 0.466, ηp2 = 0.03. Post-hoc t-tests showed that anxiety ratings were significantly lower post VR-Practice compared to Baseline, t(72) = 2.56, p = 0.038, d = 0.30. Higher anxiety rating were reported post Seminar compared to post VR-Practice, t(72) = 2.38, p = 0.040, d = 0.28. There was no difference in anxiety ratings between Baseline and post Seminar, t(72) = 0.18, p = 0.857, d = 0.02. In sum, participants’ feeling of anxiety was reduced by the VR practice session but then increased for the seminar presentation (Fig. 1E).
Fear of public speaking—PRCS
Participants’ general fear of public speaking was assessed at baseline and after the presentation in the seminar using the Personal Report of Confidence as a Speaker questionnaire (PRCS)25. A mixed ANOVA revealed a marginal significant effect of Time Point, F(1,68) = 3.87, p = 0.053, ηp2 = 0.05, but no effect of Audience, F(1,68) = 0.03, p = 0.967, ηp2 < 0.01, and no interaction effect, F(2, 68) = 0.94, p = 0.395, ηp = 0.03. Fear of public speaking decreased over the course of the study over all audience groups (Baseline: Mean = 11.09, SD = 6.21; post Seminar: Mean = 10.41, SD = 6.89).
Self-evaluation of performance
Participants evaluation of their own presentation performance was measured as general self-efficacy via GSE questionnaire as well as participants’ rating of their believe about the own performance.
Self-efficacy
General self-efficacy measured via the GSE questionnaire was analyzed with respect to Time Point and Audience Behavior (Fig. 2A). The analysis revealed a main effect of Time Point, F(1.56, 109.29) = 6.93, p = 0.003, ηp2 = 0.09 (ε = 0.78), but no effect of Audience, F(2, 70) = 0.10, p = 0.904, ηp2 < 0.01, and no interaction effect, F(3.12, 109.29) = 0.24, p = 0.877, ηp2 < 0.01 (ε = 0.78). Post-hoc t-tests revealed that self efficacy increased from Baseline to post VR-Practice, t(72) = 2.52, p = 0.028, d = 0.30, and from Baseline to post Seminar, t(72) = 3.10, p = 0.008, d = 0.36. There was no significant increase from post VR-Practice to post Seminar, (t(72) = 1.91, p = 0.060, d = 0.22. In sum, the general measure of self-efficacy was increased after the VR practice and this increase was maintained after the seminar presentation.
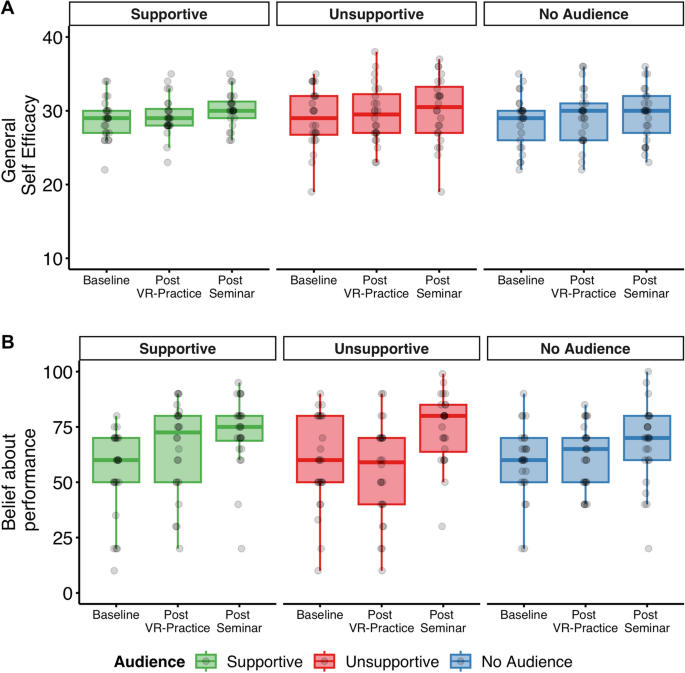
(A) Self efficacy as assessed via the GSE and (B) subjective belief about one’s performance. Individual data points shown as a function of Time Point (within-subject) and Audience (between-subject). See Supplementary Material Fig. S2 for an illustration where different audience behaviors are aggregated within time points.
Subjective belief about performance
As a subjective measure of public speaking performance, participants rated their believes about their presentation performance (Fig. 2B). A mixed-effect ANOVA revealed an interaction effect between Time Point and Audience, F(3.36, 117.46) = 2.77, p = 0.039, ηp2 = 0.07 (ε = 0.84), a main effect of Time Point, F(1.68, 117.46) = 17.88, p < 0.001, ηp2 = 0.20 (ε = 0.84), but no main effect of Audience, F(2, 70) = 0.07, p = 0.928, ηp2 < 0.01.
Post-hoc t-test were conducted to follow-up on the interaction effect. When audience showed supportive behavior there was a more positive belief about performance from baseline (M = 54,38, SD = 19.91) to the assessment post Seminar (M = 72.50, SD = 16.55), t(23) = 3.35, p = 0.008, d = 0.68. Believes about performance post VR-practice were at an intermediate level (M = 65.71, SD = 20.46), with only marginal significant differences to either baseline, t(23) = 2.24, p = 0.070, d = 0.46, or the assessment post Seminar, t(23) = − 2.24, p = 0.070, d = -0.46.
In contrast, when comparing believes about performance in the group with unsupportive audience behavior, we found that believes about performance did not change from baseline (M = 59.08, SD = 21.35) to post VR-practice (M = 54.92, SD = 22.44), t(23) = − 1.12, p = 0.273, d = − 0.22. But there was a significant increase in believes about performance post Seminar (M = 74.54, SD = 15.87) compared to assessment post VR-practice, t(23) = 5.41, p < 0.001, d = 1.11, or at baseline, t(23) = 3.93, p = 0.001, d = 0.80. There were no changes in believes about performance between baseline, post VR-practice, and post Seminar in the no audience group (Baseline: M = 59.20, SD = 16.87; Post VR-Practice: M = 61.80, SD = 14.35, Post Seminar: M = 67.40, SD = 18.14; all comparisons p > 0.05).
Finally, we compared whether groups differed in changes from baseline either at post VR-practice or post Seminar. There was a marginal significant difference in changes about believes from baseline to post VR-practice between the group with supportive audience behavior (MDiff = 11.33, SDDiff = 24.77) compared to the group with unsupportive audience behavior (MDiff = -4.17, SDDiff = 18.16), t(42.18) = 2.36, p = 0.053, d = 0.71. There were no other group differences in changes about believes from baseline (all p > 0.10).
In summary, these results demonstrate that audience group influenced believes about performance in the practice session but not in the seminar. Furthermore, believes about performance when giving the actual presentation were higher than at practice or baseline.
Presence
Social and physical presence during the VR practice was assessed with the IPQ and MPS questionnaires and analyzed using ANOVA with the between-subject factor Audience Behavior (full results are presented in Table 1). There was a significant effect of Audience on Social Presence subscale of the MPS. Post-hoc t-tests revealed that social presence was increased for supportive audience behavior group compared to the no audience group, t(45.21) = 3.02, p = 0.012, d = 0.86. There was no difference between supportive and unsupportive audience group, t(45.11) = 1.20, p = 0.237, d = 0.35, and between unsupportive audience behavior group and no audience group, t(46.83) = 1.95, p = 0.115, d = 0.56. Public speaking in front of a supportive audience was related to the highest rating of social presence.
Other-evaluation of performance
Finally, we also measured participants’ performance during their public speaking presentations in front of a real audience in an online seminar. Course instructors (blinded to the experimental manipulation) were asked to rate rhetorical quality as well as speaker confidence of participants’ presentations in the seminar (Fig. 3). While, there was no effect of Audience on the ratings of rhetorical quality, F(2,70) = 0.76, p = 0.470, ηp2 = 0.02, there was a significant effect of Audience on ratings of speaker confidence, F(2,70) = 4.18, p = 0.019, ηp2 = 0.11. Post-hoc t-tests revealed that speakers in the supportive audience group were rated as significantly more confident than speakers in the unsupportive audience group, t(42.19) = 2.90, p = 0.018, d = 0.84. There was no significant difference between the supportive audience group and the group with no audience, t(45.64) = 1.93, p = 0.120, d = 0.55, or between the unsupportive group and the group with no audience, t(46.16) = − 1.02, p = 0.312.
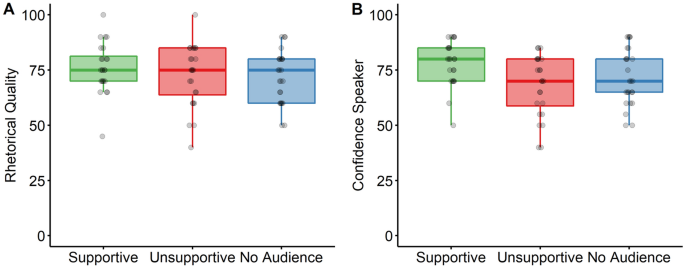
Course instructors’ evaluation of public speaking performance in the seminar with respect to rhetorical quality (A) and confidence (B) as a function of audience group.
Source link


